Epithelium Visualization
[1]:
import tyssue

import numpy as np
import pandas as pd

import matplotlib.pylab as plt
%matplotlib inline
import ipyvolume as ipv


from tyssue import Sheet, SheetGeometry  as geom
from tyssue.generation import three_faces_sheet
from tyssue.draw import sheet_view
from tyssue import config
from tyssue import Monolayer, config
from tyssue.generation import extrude
[2]:
datasets, specs = three_faces_sheet()
sheet = Sheet('3cells_2D', datasets, specs)


geom.update_all(sheet)
[3]:
sheet.vert_df.describe().head(3)
[3]:
| x | y | z | is_active | rho | height | basal_shift | |
|---|---|---|---|---|---|---|---|
| count | 13.000000 | 1.300000e+01 | 13.0 | 13.0 | 13.0 | 13.0 | 13.0 |
| mean | 0.000000 | -8.540177e-18 | 0.0 | 1.0 | 0.0 | -4.0 | 4.0 |
| std | 1.172604 | 1.172570e+00 | 0.0 | 0.0 | 0.0 | 0.0 | 0.0 |
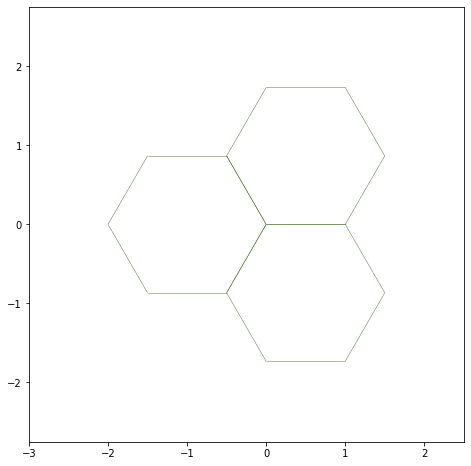
Matplotlib based representation
Epithelial sheet representation
The default
[4]:
draw_specs = tyssue.config.draw.sheet_spec()
[5]:
fig, ax = sheet_view(sheet, ['x', 'y'])


ax.set_xlim(-3, 2.5)
ax.set_ylim(-2.75, 2.75)
fig.set_size_inches((8, 8))
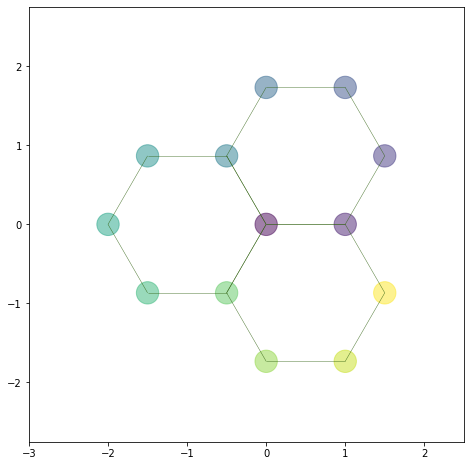
Coloring
[6]:
## Let's add a column to sheet.vert_df
sheet.vert_df['rand'] = np.linspace(0.0, 1.0, num=sheet.vert_df.shape[0])

cmap = plt.cm.get_cmap('viridis')
color_cmap = cmap(sheet.vert_df.rand)
draw_specs['vert']['visible'] = True

draw_specs['vert']['color'] = color_cmap
draw_specs['vert']['alpha'] = 0.5
draw_specs['vert']['s'] = 500
[7]:
coords = ['x', 'y']
fig, ax = sheet_view(sheet, coords, **draw_specs)

ax.set_xlim(-3, 2.5)
ax.set_ylim(-2.75, 2.75)
fig.set_size_inches((8, 8))
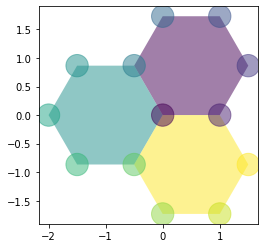
Filling the cells
[8]:
sheet.face_df['col'] = np.linspace(0.0, 1.0,
                                    num=sheet.face_df.shape[0])

cmap = plt.cm.get_cmap('viridis')
color_cmap = cmap(sheet.face_df.col)

draw_specs['edge']['visible'] = False

draw_specs['face']['visible'] = True
draw_specs['face']['color'] = sheet.face_df['col']
draw_specs['face']['alpha'] = 0.5


fig, ax = sheet_view(sheet, coords, **draw_specs)
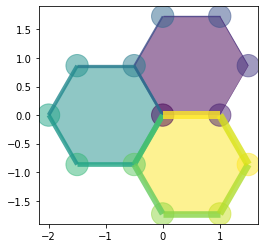
[9]:
draw_specs['edge']['visible'] = True

#draw_specs['face']['visible'] = False
draw_specs['face']['color'] = color_cmap
draw_specs['face']['alpha'] = 0.5

edge_color = np.linspace(0.0, 1.0,
                        num=sheet.edge_df.shape[0])

cmap = plt.cm.get_cmap('viridis')
edge_cmap = cmap(edge_color)
draw_specs['edge']['color'] = edge_cmap #[0, 0, 0, 1]
#draw_specs['edge']['color'] = [0, 0, 0, 0.2]

draw_specs['edge']['width'] = 8. * np.linspace(0.0, 1.0,
                        num=sheet.edge_df.shape[0])
[10]:
fig, ax = sheet_view(sheet, coords, **draw_specs)
Ipyvolume based
[11]:
extruded = extrude(sheet.datasets, method='translation')
specs = config.geometry.bulk_spec()
monolayer = Monolayer('mono', extruded, specs)


ipv.clear()
fig2, mesh = sheet_view(monolayer, mode="3D")
fig2
Vertex based color
[12]:
color = (monolayer.vert_df.x**2
         + monolayer.vert_df.y**2
         + monolayer.vert_df.z**2)


ipv.clear()
fig2, mesh = sheet_view(monolayer, edge={"color":color}, mode="3D")
fig2
Edge based color
[13]:
color = monolayer.edge_df['dy']
ipv.clear()
fig2, mesh = sheet_view(monolayer, edge={"color":color}, mode="3D")
fig2
### Displaying faces
[14]:
draw_specs = config.draw.sheet_spec()

draw_specs['face']['visible'] = True


#draw_specs['face']['visible'] = False
draw_specs['face']['color'] = np.random.random(monolayer.face_df.shape[0])

draw_specs['face']['alpha'] = 0.5

ipv.clear()
fig2, mesh = sheet_view(monolayer, mode="3D", **draw_specs)
fig2
### Higlighting faces
[15]:
from tyssue.draw import highlight_cells, highlight_faces
[16]:
highlight_faces(monolayer.face_df, [0, 2, 3], reset_visible=True)

ipv.clear()
fig2, mesh = sheet_view(monolayer, mode="3D", **draw_specs)
fig2
[17]:
highlight_cells(monolayer, 1, reset_visible=True)

ipv.clear()
fig2, mesh = sheet_view(monolayer, mode="3D", **draw_specs)
fig2
[ ]: