Epithelium Visualization#
As we saw in the Bases section, parameters are passed around in tyssue through specifications, nested dictionaries of parameters. We use a similar mechanism to specify visualization functions.
Most visualization will be done with the sheet_view function.
from pprint import pprint
import numpy as np
import pandas as pd

import matplotlib.pylab as plt
%matplotlib inline
import ipyvolume as ipv

import tyssue

from tyssue import Sheet, SheetGeometry  as geom
from tyssue.generation import three_faces_sheet
from tyssue.draw import sheet_view
from tyssue import config
from tyssue import Monolayer, config, MonolayerGeometry
from tyssue.generation import extrude
/tmp/ipykernel_3485/2998151658.py:3: DeprecationWarning:
Pyarrow will become a required dependency of pandas in the next major release of pandas (pandas 3.0),
(to allow more performant data types, such as the Arrow string type, and better interoperability with other libraries)
but was not found to be installed on your system.
If this would cause problems for you,
please provide us feedback at https://github.com/pandas-dev/pandas/issues/54466

  import pandas as pd
---------------------------------------------------------------------------
ModuleNotFoundError                       Traceback (most recent call last)
Cell In[1], line 7
      5 import matplotlib.pylab as plt
      6 get_ipython().run_line_magic('matplotlib', 'inline')
----> 7 import ipyvolume as ipv
      9 import tyssue
     11 from tyssue import Sheet, SheetGeometry  as geom

File ~/checkouts/readthedocs.org/user_builds/tyssue/conda/latest/lib/python3.12/site-packages/ipyvolume/__init__.py:8
      6 from ipyvolume import datasets  # noqa: F401
      7 from ipyvolume import embed  # noqa: F401
----> 8 from ipyvolume.widgets import *  # noqa: F401, F403
      9 from ipyvolume.transferfunction import *  # noqa: F401, F403
     10 from ipyvolume.pylab import *  # noqa: F401, F403

File ~/checkouts/readthedocs.org/user_builds/tyssue/conda/latest/lib/python3.12/site-packages/ipyvolume/widgets.py:23
     21 import ipyvolume._version
     22 from ipyvolume.traittypes import Image
---> 23 from ipyvolume.serialize import (
     24     array_cube_tile_serialization,
     25     array_serialization,
     26     array_sequence_serialization,
     27     color_serialization,
     28     texture_serialization,
     29 )
     30 from ipyvolume.transferfunction import TransferFunction
     31 from ipyvolume.utils import debounced, grid_slice, reduce_size

File ~/checkouts/readthedocs.org/user_builds/tyssue/conda/latest/lib/python3.12/site-packages/ipyvolume/serialize.py:17
     15 import ipywidgets
     16 import ipywebrtc
---> 17 from ipython_genutils.py3compat import string_types
     19 from ipyvolume import utils
     22 logger = logging.getLogger("ipyvolume")

ModuleNotFoundError: No module named 'ipython_genutils'
datasets, _ = three_faces_sheet()
sheet = Sheet('3cells_2D', datasets)


geom.update_all(sheet)
Epithelial sheet representation#
Usually in tyssue, parameters and settings are stored in a spec nested dictionnary.
This dictionnary has 4 (2D) or 5 (3D) keys corresponding to the vertices, edges, faces (and cells) plus a “settings” key for parameters affecting the whole object. Defaults are defined in the tyssue.config module.
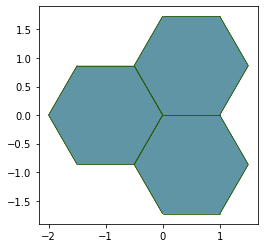
The default#
draw_specs = tyssue.config.draw.sheet_spec()

pprint(draw_specs)
{'edge': {'alpha': 0.8,
          'color': '#2b5d0a',
          'colormap': 'viridis',
          'head_width': 0.0,
          'length_includes_head': True,
          'shape': 'right',
          'visible': True,
          'width': 0.5,
          'zorder': 1},
 'face': {'alpha': 1.0, 'color': '#8aa678', 'visible': False, 'zorder': -1},
 'grad': {'alpha': 0.5, 'color': '#000a4b', 'width': 0.04},
 'vert': {'alpha': 0.3,
          'color': '#000a4b',
          's': 100,
          'visible': False,
          'zorder': 2}}
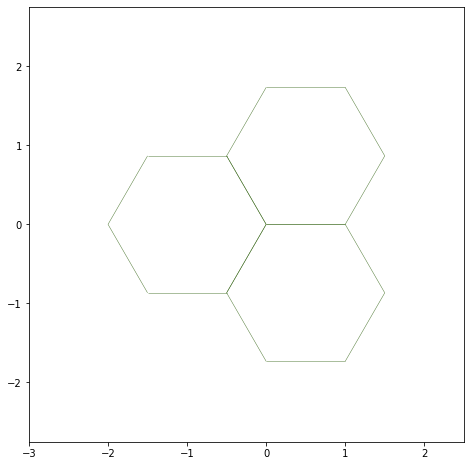
Most parameters of the dictionaries should be self explanatory. The draw_specs dictionary can be passed as **draw_specs to sheet_view.
fig, ax = sheet_view(sheet, ['x', 'y'], **draw_specs)


ax.set_xlim(-3, 2.5)
ax.set_ylim(-2.75, 2.75)
fig.set_size_inches((8, 8))
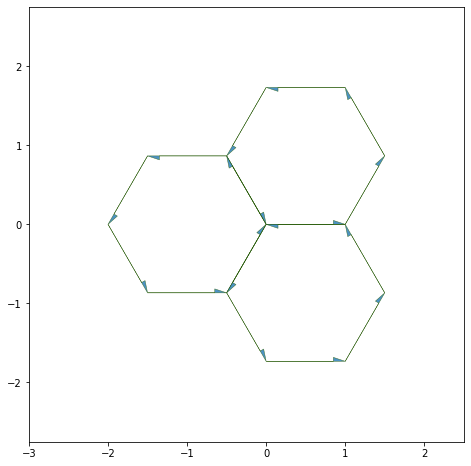
Showing the edges half-edges#
draw_specs['edge']['head_width'] = 0.1

fig, ax = sheet_view(sheet, ['x', 'y'], **draw_specs)


ax.set_xlim(-3, 2.5)
ax.set_ylim(-2.75, 2.75)
fig.set_size_inches((8, 8))
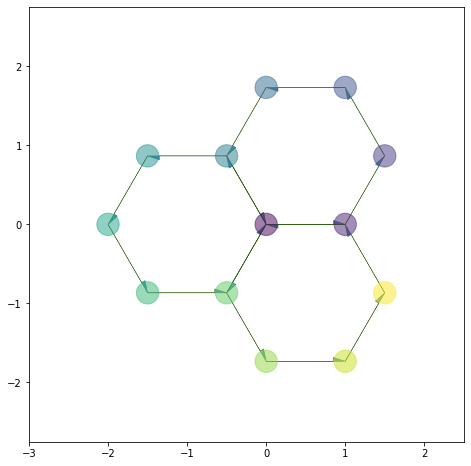
Coloring#
For vertices, we can pass color as a matplotlib color map:
## Let's add a column to sheet.vert_df
sheet.vert_df['rand'] = np.linspace(0.0, 1.0, num=sheet.vert_df.shape[0])

cmap = plt.cm.get_cmap('viridis')
color_cmap = cmap(sheet.vert_df.rand)
draw_specs['vert']['visible'] = True

draw_specs['vert']['color'] = color_cmap
draw_specs['vert']['alpha'] = 0.5
draw_specs['vert']['s'] = 500
coords = ['x', 'y']
fig, ax = sheet_view(sheet, coords, **draw_specs)

ax.set_xlim(-3, 2.5)
ax.set_ylim(-2.75, 2.75)
fig.set_size_inches((8, 8))
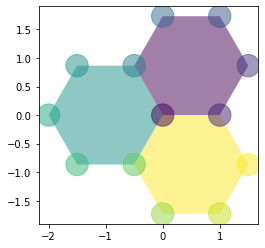
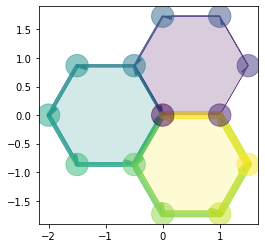
Filling the cells#
For faces and edges, we can pass directly an array or a pd.Series:
sheet.face_df['color'] = np.linspace(0.0, 1.0,
                                    num=sheet.face_df.shape[0])

draw_specs['edge']['visible'] = False

draw_specs['face']['visible'] = True
draw_specs['face']['color'] = sheet.face_df['color']
draw_specs['face']['alpha'] = 0.5


fig, ax = sheet_view(sheet, coords, **draw_specs)
draw_specs['edge']['visible'] = True

draw_specs['face']['color'] = sheet.face_df['color']
draw_specs['face']['alpha'] = 0.2

edge_color = np.linspace(0.0, 1.0,
                        num=sheet.edge_df.shape[0])

draw_specs['edge']['color'] = edge_color

# Edge width can be passed as a parameter also (in 2D only)
draw_specs['edge']['width'] = 8. * np.linspace(
    0.0, 1.0, num=sheet.edge_df.shape[0]
)
fig, ax = sheet_view(sheet, coords, **draw_specs)
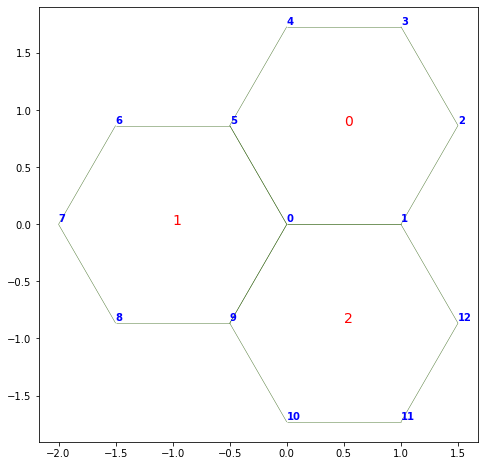
Numbering the faces or vertices#
In tough to debug situations, it can be useful to print on the graph the face and vertex indices:
fig, ax = sheet_view(sheet)
fig.set_size_inches(8, 8)

for face, data in sheet.face_df.iterrows():
    ax.text(data.x, data.y, face, fontsize=14, color="r")

for vert, data in sheet.vert_df.iterrows():
    ax.text(data.x, data.y+0.02, vert, weight="bold", color="blue")
Ipyvolume based#
extruded = extrude(sheet.datasets, method='translation')
monolayer = Monolayer('mono', extruded)

MonolayerGeometry.update_all(monolayer)

ipv.clear()
fig2, mesh = sheet_view(monolayer, mode="3D")
fig2
Vertex based color#
With IPyvolume vertices are not represented. Edge color can be specified on a vertex basis or on an edge basis.
color = (monolayer.vert_df.x**2
         + monolayer.vert_df.y**2
         + monolayer.vert_df.z**2)


ipv.clear()
fig2, mesh = sheet_view(monolayer, edge={"color":color}, mode="3D")
fig2
Edge based color#
color = monolayer.edge_df['dy']
ipv.clear()
fig2, mesh = sheet_view(monolayer, edge={"color":color}, mode="3D")
fig2
### Displaying faces
draw_specs = config.draw.sheet_spec()

draw_specs['face']['visible'] = True

#draw_specs['face']['visible'] = False
draw_specs['face']['color'] = np.random.random(monolayer.face_df.shape[0])

draw_specs['face']['alpha'] = 0.5

ipv.clear()
fig2, mesh = sheet_view(monolayer, mode="3D", **draw_specs)
fig2
### Higlighting faces
from tyssue.draw import highlight_cells, highlight_faces
highlight_faces(monolayer.face_df, [0, 2, 3], reset_visible=True)

ipv.clear()
fig2, mesh = sheet_view(monolayer, mode="3D", **draw_specs)
fig2
highlight_cells(monolayer, 1, reset_visible=True)

ipv.clear()
fig2, mesh = sheet_view(monolayer, mode="3D", **draw_specs)
fig2
For edges and faces, we can pass a callable as argument, as long as it takes an epithelium object as first argument end returns an array-like object of correct size:
def sqradius(epithelium):
    print("computing color value")
    return (epithelium.face_df[['x', 'y', 'z']]**2).sum(axis=1).to_numpy()

# we pass the function itself as a parameter, not the
draw_specs['face']['color'] = sqradius
draw_specs['face']['visible'] = 1
monolayer.face_df["visible"] = True


ipv.clear()
fig2, mesh = sheet_view(monolayer, mode="3D", **draw_specs)
fig2
computing color value
fig, ax = sheet_view(monolayer, mode="2D", **draw_specs)
computing color value
This allows to update the color values at the time we draw the tissue without explicitly changing the arguments.
This has yet to be implemented for element-level visibility also.