Single Cell apoptosis#
As decribed in Monier et al. 2015.
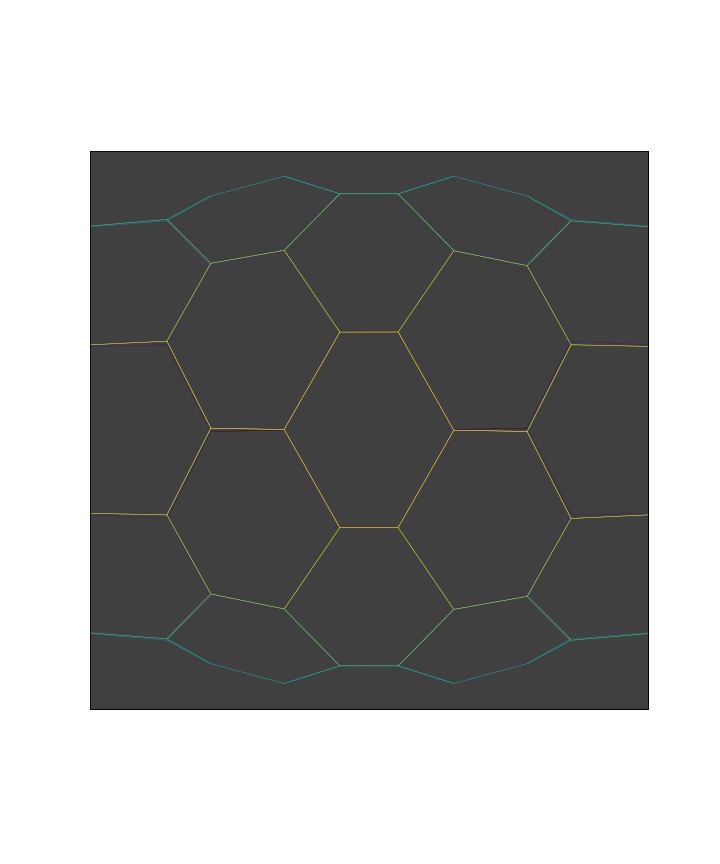
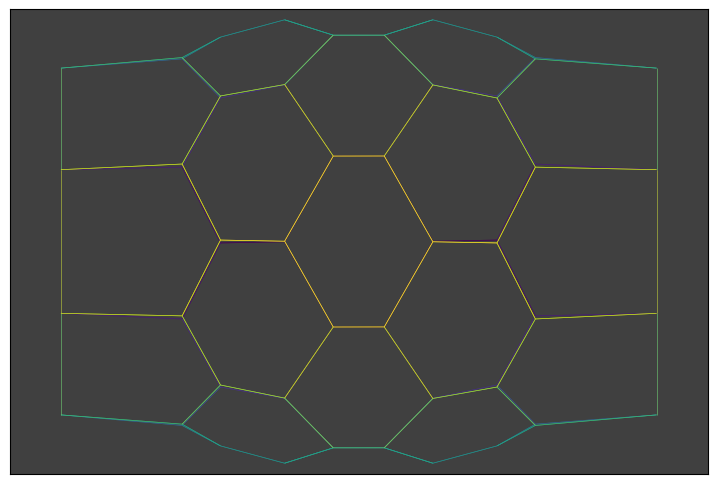
We start with a simple hexagonal apical mesh with cylindrical symmetry.
Imports#
import pandas as pd
import numpy as np
import json
import matplotlib.pylab as plt
%matplotlib inline

import ipywidgets as widgets
from IPython.display import display, Image

import tyssue
from tyssue import Sheet, History
from tyssue import config

from tyssue import SheetGeometry as geom
from tyssue.dynamics.sheet_vertex_model import SheetModel as basemodel
from tyssue.dynamics.apoptosis_model import SheetApoptosisModel as model
from tyssue.solvers.quasistatic import QSSolver


from tyssue.draw import sheet_view, create_gif, browse_history
from tyssue.io.hdf5 import load_datasets

print(tyssue.__version__)
/tmp/ipykernel_3677/4251691209.py:1: DeprecationWarning:
Pyarrow will become a required dependency of pandas in the next major release of pandas (pandas 3.0),
(to allow more performant data types, such as the Arrow string type, and better interoperability with other libraries)
but was not found to be installed on your system.
If this would cause problems for you,
please provide us feedback at https://github.com/pandas-dev/pandas/issues/54466

  import pandas as pd
collision solver could not be imported You may need to install CGAL and re-install tyssue
This module needs ipyvolume to work.
You can install it with:
$ conda install -c conda-forge ipyvolume
0.9.0
Loading the datasets and specifications#
Here it is a cylindrical hexagonal mesh.
# Read pre-recorded datasets
h5store = 'data/small_hexagonal.hf5'
from tyssue.io.hdf5 import save_datasets, load_datasets

datasets = load_datasets(h5store,
                         data_names=['face', 'vert', 'edge'])
# Corresponding specifications
specs = config.geometry.cylindrical_sheet()
sheet = Sheet('emin', datasets, specs)
sheet.sanitize(trim_borders=True, order_edges=True)

geom.update_all(sheet)
# Model
nondim_specs = config.dynamics.quasistatic_sheet_spec()
dim_model_specs = model.dimensionalize(nondim_specs)
sheet.update_specs(dim_model_specs)

sheet.get_opposite()
live_edges = sheet.edge_df[sheet.edge_df['opposite']==-1].index
dead_src = sheet.edge_df.loc[live_edges, 'srce'].unique()

### Boundary conditions
sheet.vert_df.is_active = 1
sheet.vert_df.loc[dead_src, 'is_active'] = 0

sheet.edge_df['is_active'] = sheet.upcast_srce('is_active') * sheet.upcast_trgt('is_active')
First energy minimization#
min_settings = {
#    "minimize":{
        'options': {
            'disp': False,
            'ftol': 1e-6,
            'gtol': 1e-5},
#    }
}
solver = QSSolver()

res = solver.find_energy_min(sheet, geom, model, **min_settings)
print(res['success'])
True
Custom display function#
def leg_joint_view(sheet, coords=['z', 'x', 'y']):

    geom.update_all(sheet)
    x, y, z = coords
    datasets = {}

    datasets['face'] = sheet.face_df.sort_values(z)
    datasets['vert'] = sheet.vert_df.sort_values(z)
    edge_z = 0.5 * (sheet.upcast_srce(sheet.vert_df[z]) +
                    sheet.upcast_trgt(sheet.vert_df[z]))
    datasets['edge'] = sheet.edge_df.copy()
    datasets['edge'][z] = edge_z
    datasets['edge'] = datasets['edge'].sort_values(z)

    tmp_sheet = Sheet('tmp', datasets,
                      sheet.specs)
    tmp_sheet.reset_index()

    draw_specs = {
        'vert': {
            'visible': False
            },
        'edge': {
            'color': tmp_sheet.edge_df[z],
            #'zorder': depth.values
            }
        }

    fig, ax = sheet_view(tmp_sheet, coords[:2], mode='2D', **draw_specs)
    ax.set_xlim(-15, 15)
    ax.set_ylim(-10, 10)
    ax.set_facecolor('#404040')
    ax.set_xticks([])
    ax.set_yticks([])
    fig.set_size_inches((10, 12))
    return fig, ax

fig, ax = leg_joint_view(sheet)
Choosing an apoptotic cell#
apoptotic_cell = 16
print('Apoptotic cell position:\n{}'.format(sheet.face_df.loc[apoptotic_cell, sheet.coords]))
apoptotic_edges = sheet.edge_df[sheet.edge_df['face'] == apoptotic_cell]
apoptotic_verts = apoptotic_edges['srce'].values
print("Indices of the apoptotic vertices: {}".format(apoptotic_verts))
Apoptotic cell position:
x   -7.994251
y    3.348658
z   -4.493606
Name: 16, dtype: float64
Indices of the apoptotic vertices: [33 42 34 41 43 44]
Cell behaviours, such as division or apoptosis, are defined as a series of unit changes in the tissue, such as the cell growth, or the abscission of the cell face once division is complete. For a given behavior, the next step often depends on the current state. This is managed by an EventManager object, which runs the behaviour.
from tyssue.behaviors.sheet import apoptosis
from tyssue.behaviors import EventManager


manager = EventManager('face')


sheet.settings['apoptosis'] = {
    'shrink_rate': 1.2,
    'critical_area': 8.,
    'radial_tension': 0.2,
    'contractile_increase': 0.3,
    'contract_span': 2
    }

sheet.face_df['id'] = sheet.face_df.index.values
manager.append(apoptosis, face_id=apoptotic_cell, **sheet.settings['apoptosis'])
Here is the code for the apoptosis behavior:
def apoptosis(sheet, manager, **kwargs):
    """Apoptotic behavior

    While the cell's apical area is bigger than a threshold, the
    cell shrinks, and the contractility of its neighbors is increased.
    once the critical area is reached, the cell is eliminated
    from the apical surface through successive type 1 transition. Once
    only three sides are left, the cell is eliminated from the tissue.

    Parameters
    ----------
    sheet : a :class:`Sheet` object
    manager : a :class:`EventManager` object
    face_id : int,
        the id of the apoptotic cell
    shrink_rate : float, default 0.1
        the rate of reduction of the cell's prefered volume
        e.g. the prefered volume is devided by a factor 1+shrink_rate
    critical_area : area at which the face is eliminated from the sheet
    radial_tension : amount of radial tension added at each contraction steps
    contractile_increase : increase in contractility at the cell neighbors
    contract_span : number of neighbors affected by the contracitity increase
    geom : the geometry class used
    """

    apoptosis_spec = default_apoptosis_spec
    apoptosis_spec.update(**kwargs)
    face = apoptosis_spec["face"]

    if sheet.face_df.loc[face, "area"] > apoptosis_spec["critical_area"]:
        # Shrink and pull
        shrink(sheet, face, apoptosis_spec["shrink_rate"])
        ab_pull(sheet, face, apoptosis_spec["radial_tension"])
        # contract neighbors
        neighbors = sheet.get_neighborhood(
            face, apoptosis_spec["contract_span"]
        ).dropna()
        neighbors["id"] = sheet.face_df.loc[neighbors.face, "id"].values
        manager.extend(
            [
                (
                    contraction,
                    {
                        "face_id": neighbor["id"],
                        "contractile_increase": (
                            apoptosis_spec["contractile_increase"] / neighbor["order"],
                        ),
                    },
                )
                for _, neighbor in neighbors.iterrows()
            ]
        )
        done = False
    else:
        if sheet.face_df.loc[face, "num_sides"] > 3:
            exchange(sheet, face, apoptosis_spec["geom"])
            done = False
        else:
            remove(sheet, face, apoptosis_spec["geom"])
            done = True
    if not done:
        manager.append(apoptosis, **apoptosis_spec)
We perform the events at each time points to run the simulation
t = 0
stop=100

progress = widgets.IntProgress(min=0, max=stop)
progress.value = 0
display(progress)

history = History(sheet)

while manager.current and t < stop:
    manager.execute(sheet)
    t += 1
    progress.value = t
    res = solver.find_energy_min(sheet, geom, model, **min_settings)
    history.record()
    manager.update()
/home/docs/checkouts/readthedocs.org/user_builds/tyssue/conda/latest/lib/python3.12/site-packages/tyssue/topology/base_topology.py:194: FutureWarning: Series.__getitem__ treating keys as positions is deprecated. In a future version, integer keys will always be treated as labels (consistent with DataFrame behavior). To access a value by position, use `ser.iloc[pos]`
  new_vert_data[sheet.coords] = sheet.vert_df.loc[verts, sheet.coords].mean()
3D view with ipyvolume#
color = sheet.vert_df['y']
fig, mesh = sheet_view(sheet, coords=['z', 'x', 'y'], edge={"color":color}, mode="3D")
fig
---------------------------------------------------------------------------
NameError                                 Traceback (most recent call last)
Cell In[8], line 2
      1 color = sheet.vert_df['y']
----> 2 fig, mesh = sheet_view(sheet, coords=['z', 'x', 'y'], edge={"color":color}, mode="3D")
      3 fig

File ~/checkouts/readthedocs.org/user_builds/tyssue/conda/latest/lib/python3.12/site-packages/tyssue/draw/__init__.py:35, in sheet_view(sheet, coords, ax, mode, **draw_specs_kw)
     33     return quick_edge_draw(sheet, coords[:2], ax, **edge_kw)
     34 if mode == "3D":
---> 35     return sheet_view_3d(sheet, coords, **draw_specs_kw)
     36 if mode == "vispy":
     37     return sheet_view_vispy(sheet, coords, **draw_specs_kw)

File ~/checkouts/readthedocs.org/user_builds/tyssue/conda/latest/lib/python3.12/site-packages/tyssue/draw/ipv_draw.py:77, in sheet_view(sheet, coords, **draw_specs_kw)
     75 draw_specs = sheet_spec()
     76 spec_updater(draw_specs, draw_specs_kw)
---> 77 fig = ipv.gcf()
     78 fig.meshes = fig.meshes + _get_meshes(sheet, coords, draw_specs)
     79 box_size = max(*(np.ptp(sheet.vert_df[u]) for u in sheet.coords))

NameError: name 'ipv' is not defined
browse_history(history, edge={"color":lambda s : s.edge_df["length"]})
Provided you have ImageMagick installed, we can convert the output to a nice gif, like so:
create_gif(
    history,
    'single_apopto.gif',
    num_frames=15,
    draw_func=leg_joint_view
)
Image("single_apopto.gif")