Type 1 transition#
import pandas as pd
import numpy as np
import json
import matplotlib.pylab as plt
%matplotlib inline

from tyssue import Sheet, Monolayer, config
from tyssue import SheetGeometry as geom

# What we're here for
from tyssue.topology.sheet_topology import type1_transition
from tyssue.topology.base_topology import collapse_edge, remove_face
from tyssue.topology.sheet_topology import split_vert as sheet_split
from tyssue.topology.bulk_topology import split_vert as bulk_split
from tyssue.topology import condition_4i, condition_4ii

## model and solver
from tyssue.dynamics.sheet_vertex_model import SheetModel as model
from tyssue.solvers.quasistatic import QSSolver
from tyssue.generation import extrude
from tyssue.dynamics import model_factory, effectors

# 2D plotting
from tyssue.draw import sheet_view, highlight_cells

#I/O
from tyssue.io import hdf5
plt.style.use('bmh')

import logging


import numpy as np
import pandas as pd
import ipyvolume as ipv

import matplotlib.pylab as plt
%matplotlib inline
/tmp/ipykernel_3580/508352015.py:1: DeprecationWarning:
Pyarrow will become a required dependency of pandas in the next major release of pandas (pandas 3.0),
(to allow more performant data types, such as the Arrow string type, and better interoperability with other libraries)
but was not found to be installed on your system.
If this would cause problems for you,
please provide us feedback at https://github.com/pandas-dev/pandas/issues/54466

  import pandas as pd
collision solver could not be imported You may need to install CGAL and re-install tyssue
CGAL-based mesh generation utilities not found, you may need to install CGAL and build from source
C++ extensions are not available for this version
This module needs ipyvolume to work.
You can install it with:
$ conda install -c conda-forge ipyvolume
---------------------------------------------------------------------------
ModuleNotFoundError                       Traceback (most recent call last)
Cell In[1], line 35
     33 import numpy as np
     34 import pandas as pd
---> 35 import ipyvolume as ipv
     37 import matplotlib.pylab as plt
     38 get_ipython().run_line_magic('matplotlib', 'inline')

File ~/checkouts/readthedocs.org/user_builds/tyssue/conda/latest/lib/python3.12/site-packages/ipyvolume/__init__.py:8
      6 from ipyvolume import datasets  # noqa: F401
      7 from ipyvolume import embed  # noqa: F401
----> 8 from ipyvolume.widgets import *  # noqa: F401, F403
      9 from ipyvolume.transferfunction import *  # noqa: F401, F403
     10 from ipyvolume.pylab import *  # noqa: F401, F403

File ~/checkouts/readthedocs.org/user_builds/tyssue/conda/latest/lib/python3.12/site-packages/ipyvolume/widgets.py:23
     21 import ipyvolume._version
     22 from ipyvolume.traittypes import Image
---> 23 from ipyvolume.serialize import (
     24     array_cube_tile_serialization,
     25     array_serialization,
     26     array_sequence_serialization,
     27     color_serialization,
     28     texture_serialization,
     29 )
     30 from ipyvolume.transferfunction import TransferFunction
     31 from ipyvolume.utils import debounced, grid_slice, reduce_size

File ~/checkouts/readthedocs.org/user_builds/tyssue/conda/latest/lib/python3.12/site-packages/ipyvolume/serialize.py:17
     15 import ipywidgets
     16 import ipywebrtc
---> 17 from ipython_genutils.py3compat import string_types
     19 from ipyvolume import utils
     22 logger = logging.getLogger("ipyvolume")

ModuleNotFoundError: No module named 'ipython_genutils'
solver = QSSolver()

h5store = 'data/small_hexagonal.hf5'
datasets = hdf5.load_datasets(h5store,
                              data_names=['face', 'vert', 'edge'])
specs = config.geometry.cylindrical_sheet()
sheet = Sheet('emin', datasets, specs)


geom.update_all(sheet)

nondim_specs = config.dynamics.quasistatic_sheet_spec()
dim_model_specs = model.dimensionalize(nondim_specs)
sheet.update_specs(dim_model_specs, reset=True)

solver_settings = {'options': {'gtol':1e-4}}

sheet.get_opposite()
sheet.vert_df.is_active = 0

active_edges = (sheet.edge_df['opposite'] > -1)
active_verts = set(sheet.edge_df[active_edges]['srce'])

sheet.vert_df.loc[active_verts, 'is_active'] = 1

fig, ax = sheet_view(sheet, ['z', 'x'],
                     edge={'head_width': 0.5},
                     vert={'visible': False})
fig.set_size_inches(10, 6)
Reseting column contractility of the face dataset with new specs
Reseting column vol_elasticity of the face dataset with new specs
Reseting column prefered_height of the face dataset with new specs
Reseting column prefered_area of the face dataset with new specs
Reseting column prefered_vol of the face dataset with new specs
Reseting column radial_tension of the vert dataset with new specs
Reseting column is_active of the vert dataset with new specs
Reseting column ux of the edge dataset with new specs
Reseting column uy of the edge dataset with new specs
Reseting column uz of the edge dataset with new specs
Reseting column line_tension of the edge dataset with new specs
Reseting column is_active of the edge dataset with new specs
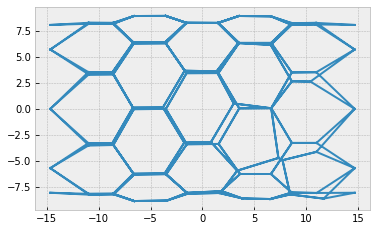
type1_transition(sheet, 82)
geom.update_all(sheet)
res = solver.find_energy_min(sheet, geom, model, **solver_settings)
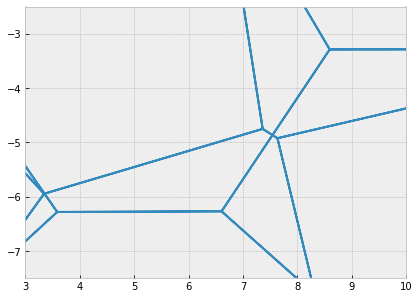
fig, ax = sheet_view(sheet, mode="quick", coords=['z', 'x'])
fig, ax = sheet_view(sheet, ['z', 'x'], mode="quick")

ax.set_xlim(3, 10)
ax.set_ylim(-7.5, -2.5)

ax.set_aspect('equal')
fig.set_size_inches(8, 5)
fig, mesh = sheet_view(sheet, mode='3D')
fig
res = solver.find_energy_min(sheet, geom, model)
print(res['success'])
fig, ax = sheet_view(sheet, ['z', 'x'], mode="quick")
True
sheet.validate()
True
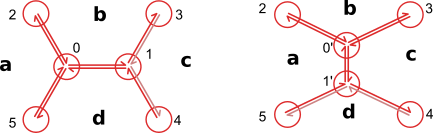
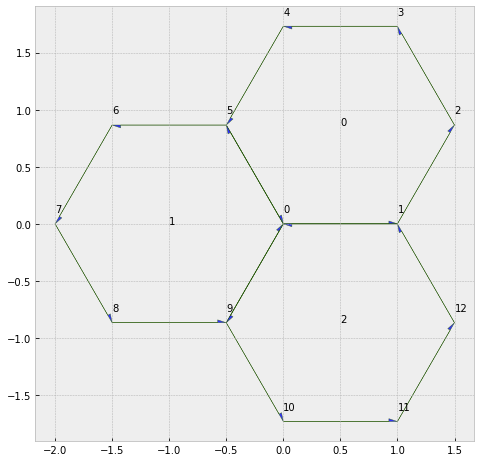
Type 1 transitions can also be performed on border faces#
from tyssue.generation import three_faces_sheet

sheet = Sheet('3f', *three_faces_sheet())
geom.update_all(sheet)
fig, ax = sheet_view(sheet, edge={'head_width': 0.05})
fig.set_size_inches(8, 8)

for face, data in sheet.face_df.iterrows():
    ax.text(data.x, data.y, face)
for vert, data in sheet.vert_df.iterrows():
    ax.text(data.x, data.y+0.1, vert)
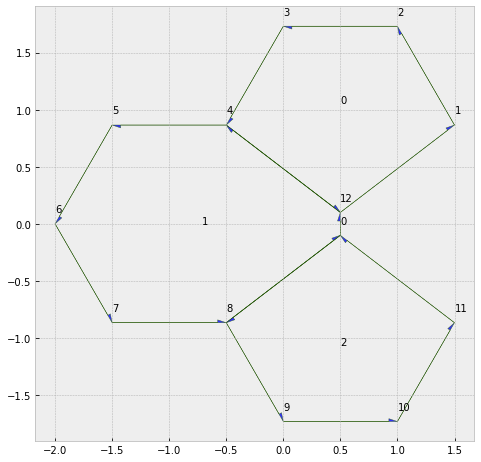
type1_transition(sheet, 0, multiplier=2)
sheet.reset_index()

geom.update_all(sheet)

fig, ax = sheet_view(sheet, edge={'head_width': 0.05})
fig.set_size_inches(8, 8)
for face, data in sheet.face_df.iterrows():
    ax.text(data.x, data.y, face)

for vert, data in sheet.vert_df.iterrows():
    ax.text(data.x, data.y+0.1, vert)
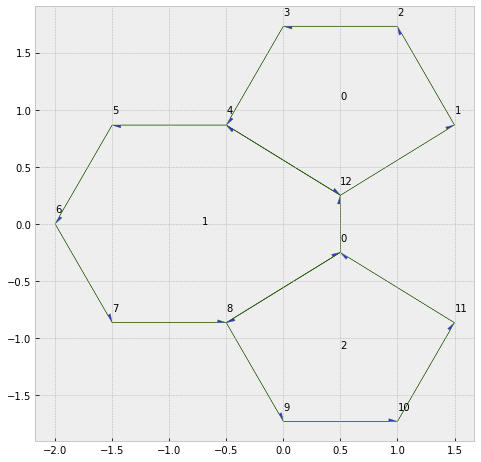
type1_transition(sheet, 16, multiplier=5)

geom.update_all(sheet)

fig, ax = sheet_view(sheet, edge={'head_width': 0.05})
fig.set_size_inches(8, 8)
for face, data in sheet.face_df.iterrows():
    ax.text(data.x, data.y, face)

for vert, data in sheet.vert_df.iterrows():
    ax.text(data.x, data.y+0.1, vert)
sheet.validate()
True
type1_transition(sheet, 17,  multiplier=5)

geom.update_all(sheet)
print(sheet.validate())

fig, ax = sheet_view(sheet, edge={'head_width': 0.05})
fig.set_size_inches(8, 8)
for face, data in sheet.face_df.iterrows():
    ax.text(data.x, data.y, face)

for vert, data in sheet.vert_df.iterrows():
    ax.text(data.x, data.y+0.1, vert)
True

Rosette#
This part is based on the following paper:
The tricellular vertex-specific adhesion molecule Sidekick facilitates polarised cell intercalation during Drosophila axis extension Tara M Finegan, Nathan Hervieux, Alexander Nestor-Bergmann, Alexander G. Fletcher, Guy B Blanchard, Benedicte Sanson bioRxiv 704932; doi: https://doi.org/10.1101/704932
In particular, the authors expose a nice way to account for rosettes and solve topology changes in a more generic and I think robust way than T1 transition. I think, it allows vertices with more than 3 out-edges to have a finite lifetime, and avoids T1 oscillations
I explore its implementation in tyssue, in 2D (also maybe in 3D, though it’s less clear how :p).
from tyssue import PlanarGeometry as geom
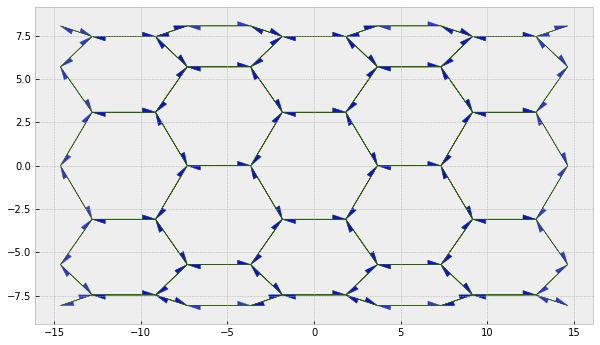
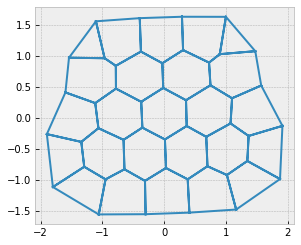
Create a small patch of cells in 2D and a simple mechanical model#
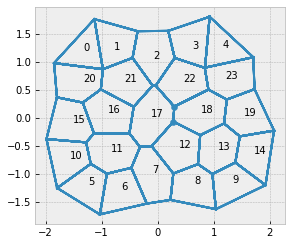
sheet = Sheet.planar_sheet_2d('flat', 30, 30, 1, 1, noise=0.2)
to_cut = sheet.cut_out([(0.1, 6), (0.1, 6)])
sheet.remove(to_cut, trim_borders=True)
sheet.sanitize(trim_borders=True)
geom.center(sheet)
geom.update_all(sheet)
sheet.update_rank()
model = model_factory(
    [
        effectors.LineTension,
        effectors.FaceContractility,
        effectors.FaceAreaElasticity
    ]
)

specs = {
    "face": {
        "contractility": 5e-2,
        "prefered_area": sheet.face_df.area.mean(),
        "area_elasticity": 1.
    },
    "edge": {
        "line_tension": 1e-2,
        "is_active": 1
    },
    "vert": {
        "is_active": 1
    },
}

sheet.update_specs(specs, reset=True)
Reseting column is_active of the vert dataset with new specs
Gradient descent#
solver = QSSolver()
res = solver.find_energy_min(sheet, geom, model)
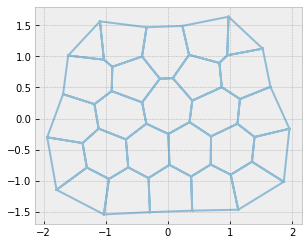
fig, ax = sheet_view(sheet, mode="quick")
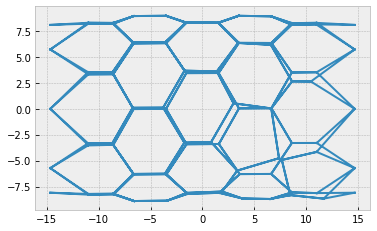
Formation of rosettes#
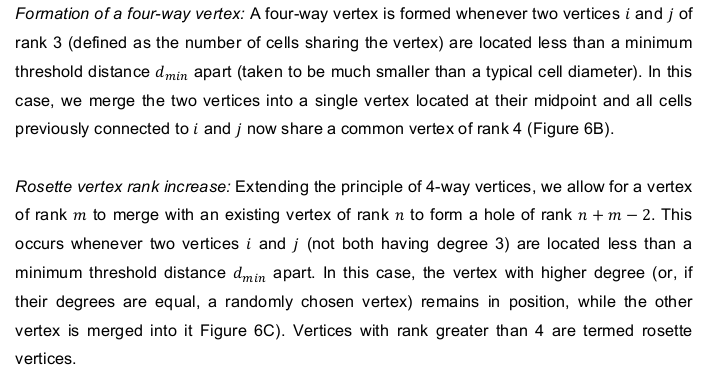
Finegan et al. 2019
Merge vertices#
Or, said otherwise, collapse an edge
fig, ax = sheet_view(sheet, mode="quick", edge={"alpha": 0.5})
center_edge = sheet.edge_df.eval("sx**2 + sy**2").idxmin()
ax.scatter(sheet.edge_df.loc[center_edge, ["sx", "tx"]],
           sheet.edge_df.loc[center_edge, ["sy", "ty"]])

collapse_edge(sheet, center_edge)
sheet.update_rank()

geom.update_all(sheet)
fig, ax = sheet_view(sheet, mode="quick", ax=ax, edge={"alpha": 0.5})

print("Maximum vertex rank: ", sheet.vert_df['rank'].max())
Maximum vertex rank: 4
res = solver.find_energy_min(sheet, geom, model)
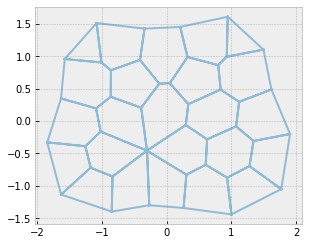
fig, ax = sheet_view(sheet, mode="quick", edge={"alpha": 0.5})
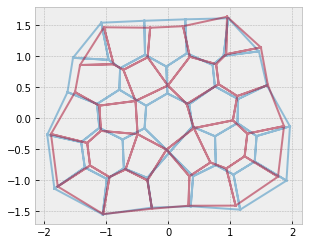
Do it again to increase rank#
fig, ax = sheet_view(sheet, mode="quick", edge={"alpha": 0.5})

for i in range(4):
    center_edge = sheet.edge_df.eval("sx**2 + sy**2").idxmin()
    collapse_edge(sheet, center_edge)
    geom.update_all(sheet)
    res = solver.find_energy_min(sheet, geom, model)
    sheet.update_rank()

fig, ax = sheet_view(sheet, mode="quick", ax=ax, edge={"alpha": 0.5})


print("Maximum vertex rank: ", sheet.vert_df['rank'].max())
Maximum vertex rank: 4
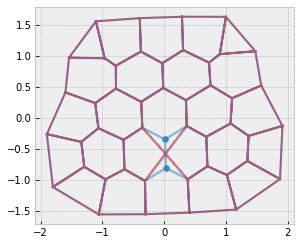
Rosettes resolution#
Finegan et al. 2019
As far as I understand, the difference between rank 5+ and rank 4 is not topological, but geometrical (the “old” vertex is moved towards the opposite cell center) and statistical because \(p_4\) is higher than \(p_{5+}\)
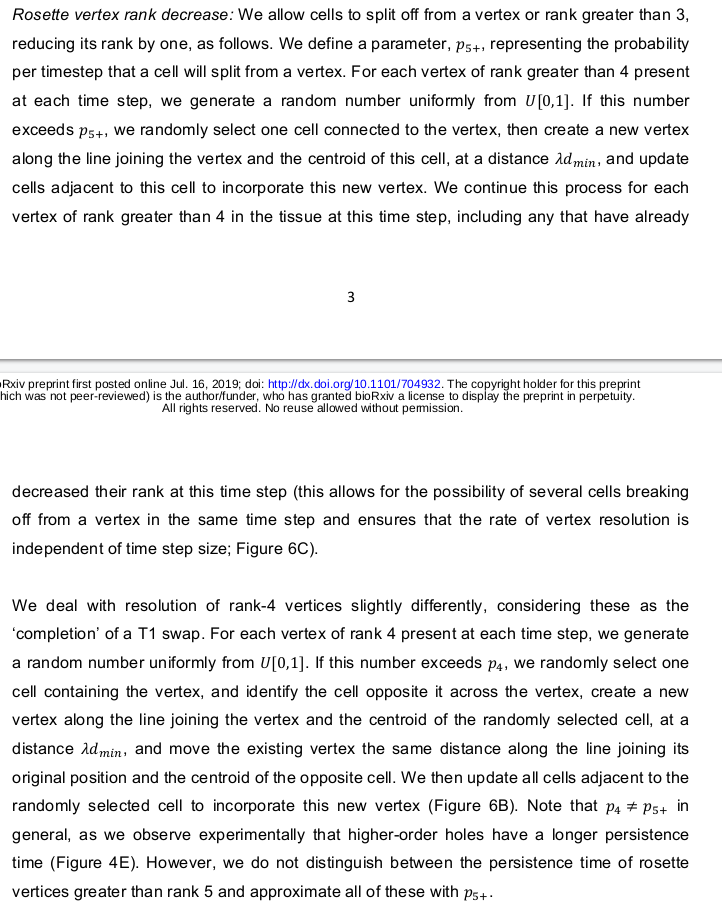
Solve for a single edge#
#sheet = bck.copy()
max_rank = sheet.vert_df['rank'].idxmax()

print("Maximum vertex rank prior to rearangement: ", sheet.vert_df['rank'].max())


fig, ax = sheet_view(sheet, mode="quick", edge={"alpha": 0.5})
max_rank_vert = sheet.vert_df['rank'].idxmax()

ax.scatter(sheet.vert_df.loc[max_rank_vert, "x"],
           sheet.vert_df.loc[max_rank_vert, "y"])

sheet_split(sheet, max_rank_vert)
sheet.update_rank()

geom.update_all(sheet)
fig, ax = sheet_view(sheet, mode="quick", ax=ax, edge={"alpha": 0.5})

print("Maximum vertex rank after rearangement: ", sheet.vert_df['rank'].max())
Maximum vertex rank prior to rearangement:  4
Maximum vertex rank after rearangement:  4
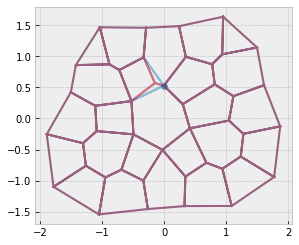
res = solver.find_energy_min(sheet, geom, model)
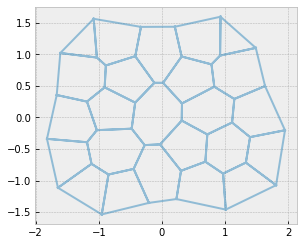
fig, ax = sheet_view(sheet, mode="quick", edge={"alpha": 0.5})
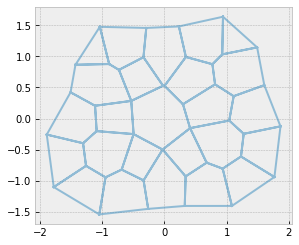
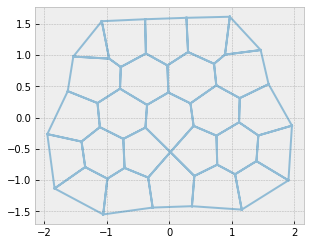
Solve repeatedly#
#sheet = bck.copy()
max_rank = sheet.vert_df['rank'].max()
print("Maximum vertex rank prior to rearangement: ", max_rank)

while max_rank > 3:
    max_rank_vert = sheet.vert_df['rank'].idxmax()

    sheet_split(sheet, max_rank_vert)
    sheet.update_rank()

    geom.update_all(sheet)

    res = solver.find_energy_min(sheet, geom, model)
    max_rank = sheet.vert_df['rank'].max()

    print("Maximum vertex rank: ", max_rank)

fig, ax = sheet_view(sheet, mode="quick", edge={"alpha": 0.5})
Maximum vertex rank prior to rearangement:  4
Maximum vertex rank:  4
Maximum vertex rank:  4
Maximum vertex rank:  4
Maximum vertex rank:  3
assert sheet.validate()
Collapse a face and resolve the rosette#
remove_face(sheet, 12)
sheet.update_rank()
geom.update_all(sheet)

res = solver.find_energy_min(sheet, geom, model)
fig, ax = sheet_view(sheet, mode="quick", edge={"alpha": 0.5})
max_rank = sheet.vert_df['rank'].max()
while max_rank > 3:
    max_rank_vert = sheet.vert_df['rank'].idxmax()

    sheet_split(sheet, max_rank_vert)
    sheet.update_rank()

    geom.update_all(sheet)

    res = solver.find_energy_min(sheet, geom, model)
    max_rank = sheet.vert_df['rank'].max()

    print("Maximum vertex rank: ", max_rank)
Maximum vertex rank:  5
Maximum vertex rank:  4
Maximum vertex rank:  3
fig, ax = sheet_view(sheet, mode="quick", edge={"alpha": 0.5})
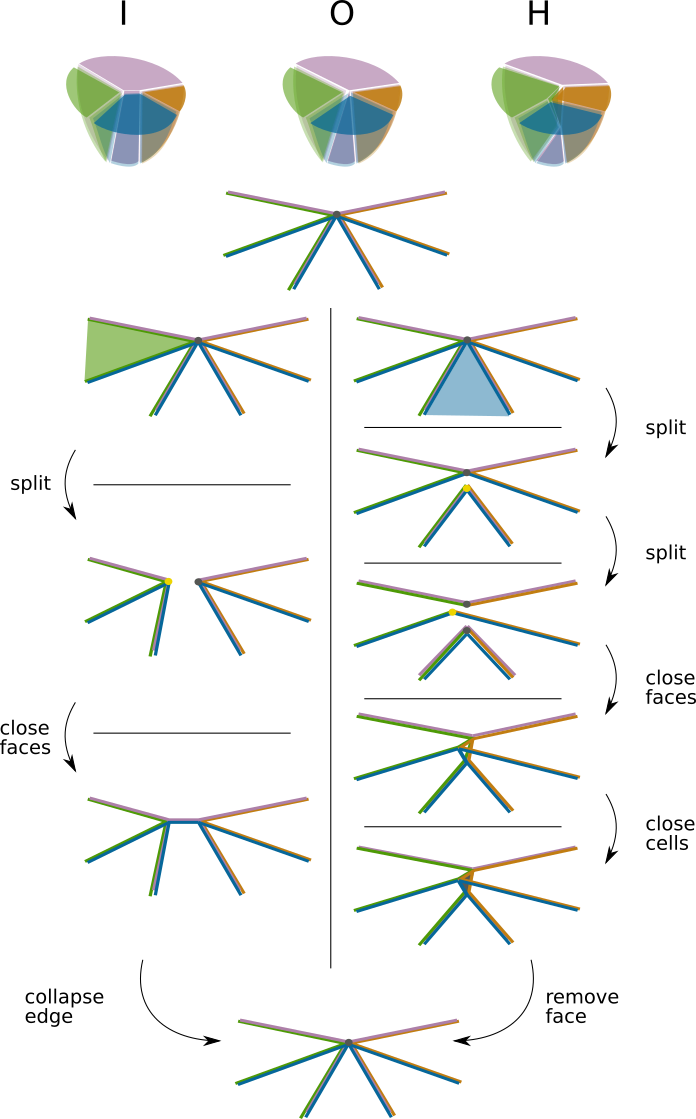
How about in 3D?#
Illustration of the split / collapse algorithm in 3D#
Extrude a monolayer from the previous sheet#
from tyssue import MonolayerGeometry as geom

# Promote the sheet to 2.5 D
sheet.update_specs(config.geometry.sheet_spec())


specs = config.geometry.bulk_spec()
datasets = extrude(sheet.datasets, method='translation')
eptm = Monolayer('mono', datasets, specs)

geom.center(eptm)
geom.update_all(eptm)

## Sanity check
assert eptm.validate()
Setup a simple mechanical model and quasistatically descend it#
model = model_factory([
    effectors.CellVolumeElasticity,
    effectors.FaceContractility,
    effectors.LineTension,
])

## Initial model settings
dyn_specs = {
    "settings": {
        "threshold_length": 1e-3,
    },
    "cell": {
        "prefered_vol": eptm.cell_df.vol.mean(),
        "prefered_area": eptm.cell_df.area.mean(),
        "vol_elasticity": 14.0,
        #"area_elasticity": 1.0,
    },
    "face": {
        #"surface_tension": 1.0,
        "contractility": 1e-2
    },
    "edge": {
        "line_tension": 0.01,
    }
}

## Those settings are set homogenously in the epithelium
eptm.update_specs(dyn_specs, reset=True)

# Lower the lateral contractility
eptm.face_df.loc[eptm.lateral_faces, 'contractility'] /= 2

solver = QSSolver(with_t1=False, with_t3=False)
res = solver.find_energy_min(eptm, geom, model)
eptm.update_rank()

ipv.clear()
eptm.face_df["visible"] =True
fig, mesh = sheet_view(
    eptm,
    mode='3D',
    face={
        "visible": True,
        "color": eptm.face_df.area
    }
)

ipv.show()
Reseting column contractility of the face dataset with new specs
Reseting column line_tension of the edge dataset with new specs
center_edge = eptm.edge_df.query('segment == "apical"').eval("sx**2 + sy**2").idxmin()

fig, ax = sheet_view(eptm, coords = ['x', 'y'], mode="quick")
for cell, (x, y) in eptm.cell_df[['x', 'y']].iterrows():
    ax.text(x, y, str(cell))
_= ax.scatter(
    eptm.edge_df.loc[center_edge, ['sx', 'tx']],
    eptm.edge_df.loc[center_edge, ['sy', 'ty']])
ret_code = collapse_edge(eptm, center_edge, allow_two_sided=True)
if ret_code:
    print('Collapse failed')
geom.update_all(eptm)

eptm.update_rank()
print("Maximum vertex rank: ", eptm.vert_df['rank'].max())

ipv.clear()
eptm.face_df["visible"] = eptm.face_df['segment'] == "lateral"
fig, mesh = sheet_view(
    eptm,
    mode='3D',
    face={
        "visible": True,
        "color": eptm.face_df.area
    }
)

ipv.show()

assert eptm.validate()


print("Maximum vertex rank: ", eptm.vert_df['rank'].max())
vert = eptm.vert_df['rank'].idxmax()
print("Rosette index: ", vert)
bck = eptm.copy()
Maximum vertex rank: 6
Maximum vertex rank:  6
Rosette index:  31
set(condition_4ii(eptm).ravel())
set()
res = solver.find_energy_min(eptm, geom, model)
eptm.settings['threshold_length'] = 0.1
bulk_split(eptm, vert, face=None, multiplier=2)

assert eptm.validate()
cell 18 is already closed
cell 22 is already closed
cell 17 is already closed
cell 12 is already closed
ipv.clear()
geom.update_all(eptm)
res = solver.find_energy_min(eptm, geom, model)

eptm.face_df["visible"] = False
#eptm.face_df["visible"] = eptm.face_df["segment"] == "lateral"
#eptm.face_df["visible"] = eptm.face_df.eval('(x**2 + (y+0.5)**2) < 0.5')
#eptm.face_df["visible"] = False
c4ii = np.unique(condition_4ii(eptm))
eptm.face_df.loc[c4ii, "visible"] = True
fig, mesh = sheet_view(
    eptm,
    mode='3D',
    face={
        "visible": True,
        "color": eptm.face_df.area
    }
)

ipv.show()
/home/admin-suz/miniconda3/lib/python3.8/site-packages/tyssue-0.8.1-py3.8-linux-x86_64.egg/tyssue/utils/utils.py:161: UserWarning: Sub epithelium appears to be empty
  warnings.warn("Sub epithelium appears to be empty")
Testing vertex split towards all possible faces#
all_edges = bck.edge_df[
    (bck.edge_df["trgt"] == vert)
    | (bck.edge_df["srce"] == vert)
]


eptms = {}
for face, edge in all_edges.reset_index().groupby("face").first()['edge'].items():
    eptm = bck.copy()
    cell = eptm.edge_df.loc[edge, "cell"]
    print(f"splitting vertex {vert} towards cell {cell} over face {face}")
    bulk_split(eptm, vert, face=face, multiplier=2)
    assert eptm.validate()
    c4i, c4ii = condition_4i(eptm), condition_4ii(eptm)
    if len(c4i):
        print(f"\nIssue with face {face}")
        print("Number of condition 4i faces : ", len(c4i))
    if len(c4ii):
        print(f"\nIssue with face {face}")
        print("Number of condition 4ii faces : ", len(c4ii))

    eptms[face] = eptm
cell 18 is already closed
cell 22 is already closed
cell 17 is already closed
cell 12 is already closed
splitting vertex 31 towards cell 12 over face 12
splitting vertex 31 towards cell 17 over face 17
cell 18 is already closed
cell 17 is already closed
cell 18 is already closed
splitting vertex 31 towards cell 18 over face 18
cell 17 is already closed
splitting vertex 31 towards cell 22 over face 22
cell 18 is already closed
cell 22 is already closed
cell 17 is already closed
cell 12 is already closed
cell 18 is already closed
cell 22 is already closed
cell 17 is already closed
cell 12 is already closed
splitting vertex 31 towards cell 18 over face 107
cell 18 is already closed
cell 22 is already closed
cell 17 is already closed
cell 12 is already closed
splitting vertex 31 towards cell 22 over face 108
cell 18 is already closed
splitting vertex 31 towards cell 18 over face 111
cell 17 is already closed
splitting vertex 31 towards cell 17 over face 112
cell 18 is already closed
cell 17 is already closed
cell 18 is already closed
cell 22 is already closed
cell 17 is already closed
cell 12 is already closed
splitting vertex 31 towards cell 17 over face 117
cell 18 is already closed
cell 22 is already closed
cell 17 is already closed
cell 12 is already closed
splitting vertex 31 towards cell 22 over face 118
cell 18 is already closed
cell 22 is already closed
cell 17 is already closed
cell 12 is already closed
splitting vertex 31 towards cell 12 over face 119
cell 18 is already closed
cell 22 is already closed
cell 17 is already closed
cell 12 is already closed
splitting vertex 31 towards cell 17 over face 120
cell 18 is already closed
cell 22 is already closed
cell 17 is already closed
cell 12 is already closed
splitting vertex 31 towards cell 12 over face 160
cell 18 is already closed
cell 22 is already closed
cell 17 is already closed
cell 12 is already closed
splitting vertex 31 towards cell 18 over face 161
ipv.clear()
geom.update_all(eptm)

eptm.face_df["visible"] = False
#eptm.face_df["visible"] = eptm.face_df["segment"] == "lateral"
#eptm.face_df["visible"] = eptm.face_df.eval('(x**2 + (y+0.5)**2) < 0.5')
#eptm.face_df["visible"] = False

eptm.face_df.loc[set(condition_4ii(eptm).ravel()[:2]), "visible"] = True
fig, mesh = sheet_view(
    eptm,
    mode='3D',
    face={
        "visible": True,
        "color": eptm.face_df.area
    }
)

ipv.show()
/home/admin-suz/miniconda3/lib/python3.8/site-packages/tyssue-0.8.1-py3.8-linux-x86_64.egg/tyssue/utils/utils.py:161: UserWarning: Sub epithelium appears to be empty
  warnings.warn("Sub epithelium appears to be empty")
Collapsing a face#
eptm.vert_df['rank'].min()
4
condition_4ii(eptm)
array([], shape=(0, 2), dtype=int64)
center_face = eptm.face_df.query("segment == 'apical'").eval("x**2 + y**2").idxmin()

remove_face(eptm, center_face)
0
ipv.clear()
geom.update_all(eptm)
res = solver.find_energy_min(eptm, geom, model)

#eptm.face_df["visible"] = False
eptm.face_df["visible"] = eptm.face_df["segment"] == "lateral"
#eptm.face_df["visible"] = eptm.face_df.eval('(x**2 + (y+0.5)**2) < 0.5')
#eptm.face_df["visible"] = False

#eptm.face_df.loc[set(condition_4ii(eptm).ravel()[:2]), "visible"] = True
fig, mesh = sheet_view(
    eptm,
    mode='3D',
    face={
        "visible": True,
        "color": eptm.face_df.area
    }
)

ipv.show()
Split the created vertex#
vert = eptm.vert_df.index[-1]

bulk_split(eptm, vert)


geom.update_all(eptm)

assert eptm.validate()
cell 2 is already closed
cell 7 is already closed
cell 12 is already closed
cell 18 is already closed
cell 11 is already closed
cell 16 is already closed
cell 17 is already closed
ipv.clear()
geom.update_all(eptm)
res = solver.find_energy_min(eptm, geom, model)

#eptm.face_df["visible"] = False
eptm.face_df["visible"] = eptm.face_df["segment"] == "lateral"
#eptm.face_df["visible"] = eptm.face_df.eval('(x**2 + (y+0.5)**2) < 0.5')
#eptm.face_df["visible"] = False

#eptm.face_df.loc[set(condition_4ii(eptm).ravel()[:2]), "visible"] = True
fig, mesh = sheet_view(
    eptm,
    mode='3D',
    face={
        "visible": True,
        "color": eptm.face_df.area
    }
)

ipv.show()
eptm.update_rank()

print("Maximum vertex rank: ", eptm.vert_df['rank'].max())

vert = eptm.vert_df['rank'].idxmax()
print("Rosette index: ", vert)
Maximum vertex rank:  14
Rosette index:  84
Solve repeatedly#
from itertools import count
for i in count():
    vert = eptm.vert_df['rank'].idxmax()
    try:
        bulk_split(eptm, vert)
    except ValueError:
        continue
    eptm.update_rank()
    max_rank = eptm.vert_df['rank'].max()
    print("Maximum vertex rank: ", max_rank)

    geom.update_all(eptm)
    res = solver.find_energy_min(eptm, geom, model)
    assert eptm.validate()
    if max_rank < 5:
        break

    elif i > 100:
        raise RecursionError
cell 7 is already closed
cell 18 is already closed
cell 22 is already closed
cell 16 is already closed
cell 21 is already closed
cell 17 is already closed
Maximum vertex rank: 12
cell 22 is already closed
cell 16 is already closed
cell 12 is already closed
cell 21 is already closed
cell 17 is already closed
Maximum vertex rank: 10
cell 18 is already closed
cell 22 is already closed
cell 11 is already closed
cell 16 is already closed
cell 21 is already closed
Maximum vertex rank: 8
cell 18 is already closed
cell 22 is already closed
cell 11 is already closed
cell 16 is already closed
cell 17 is already closed
Maximum vertex rank: 6
cell 18 is already closed
cell 22 is already closed
cell 17 is already closed
cell 11 is already closed
Maximum vertex rank: 4
ipv.clear()
geom.update_all(eptm)

#eptm.face_df["visible"] = False
eptm.face_df["visible"] = True #eptm.face_df["segment"] == "lateral"
#eptm.face_df["visible"] = eptm.face_df.eval('(x**2 + (y+0.5)**2) < 0.5')
#eptm.face_df["visible"] = False

#eptm.face_df.loc[set(condition_4ii(eptm).ravel()[:2]), "visible"] = True
fig, mesh = sheet_view(
    eptm,
    mode='3D',
    face={
        "visible": True,
        "color": eptm.face_df.area
    }
)

ipv.show()